Unlike portions of central and southern Idaho, northern Idaho’s dense forests and brush provide excellent cover making it difficult to see animals. These forests provide great habitat for white-tailed deer but make counting them tough. In fact, these habitats do such a good job of hiding white-tails that the aerial surveys used by Fish and Game to estimate mule deer and elk populations in other parts of the state do not work here. So, if biologists cannot count them on the hoof, how do they track changes in white-tailed deer populations? Well, one starting point is to have a better grasp on is the "graveyard" using hunter harvest report data.
Clearwater wildlife blog series: Installment #2- How harvest statistics are used
idfg-jbruns
What are harvest statistics and why are they important to white-tailed deer?
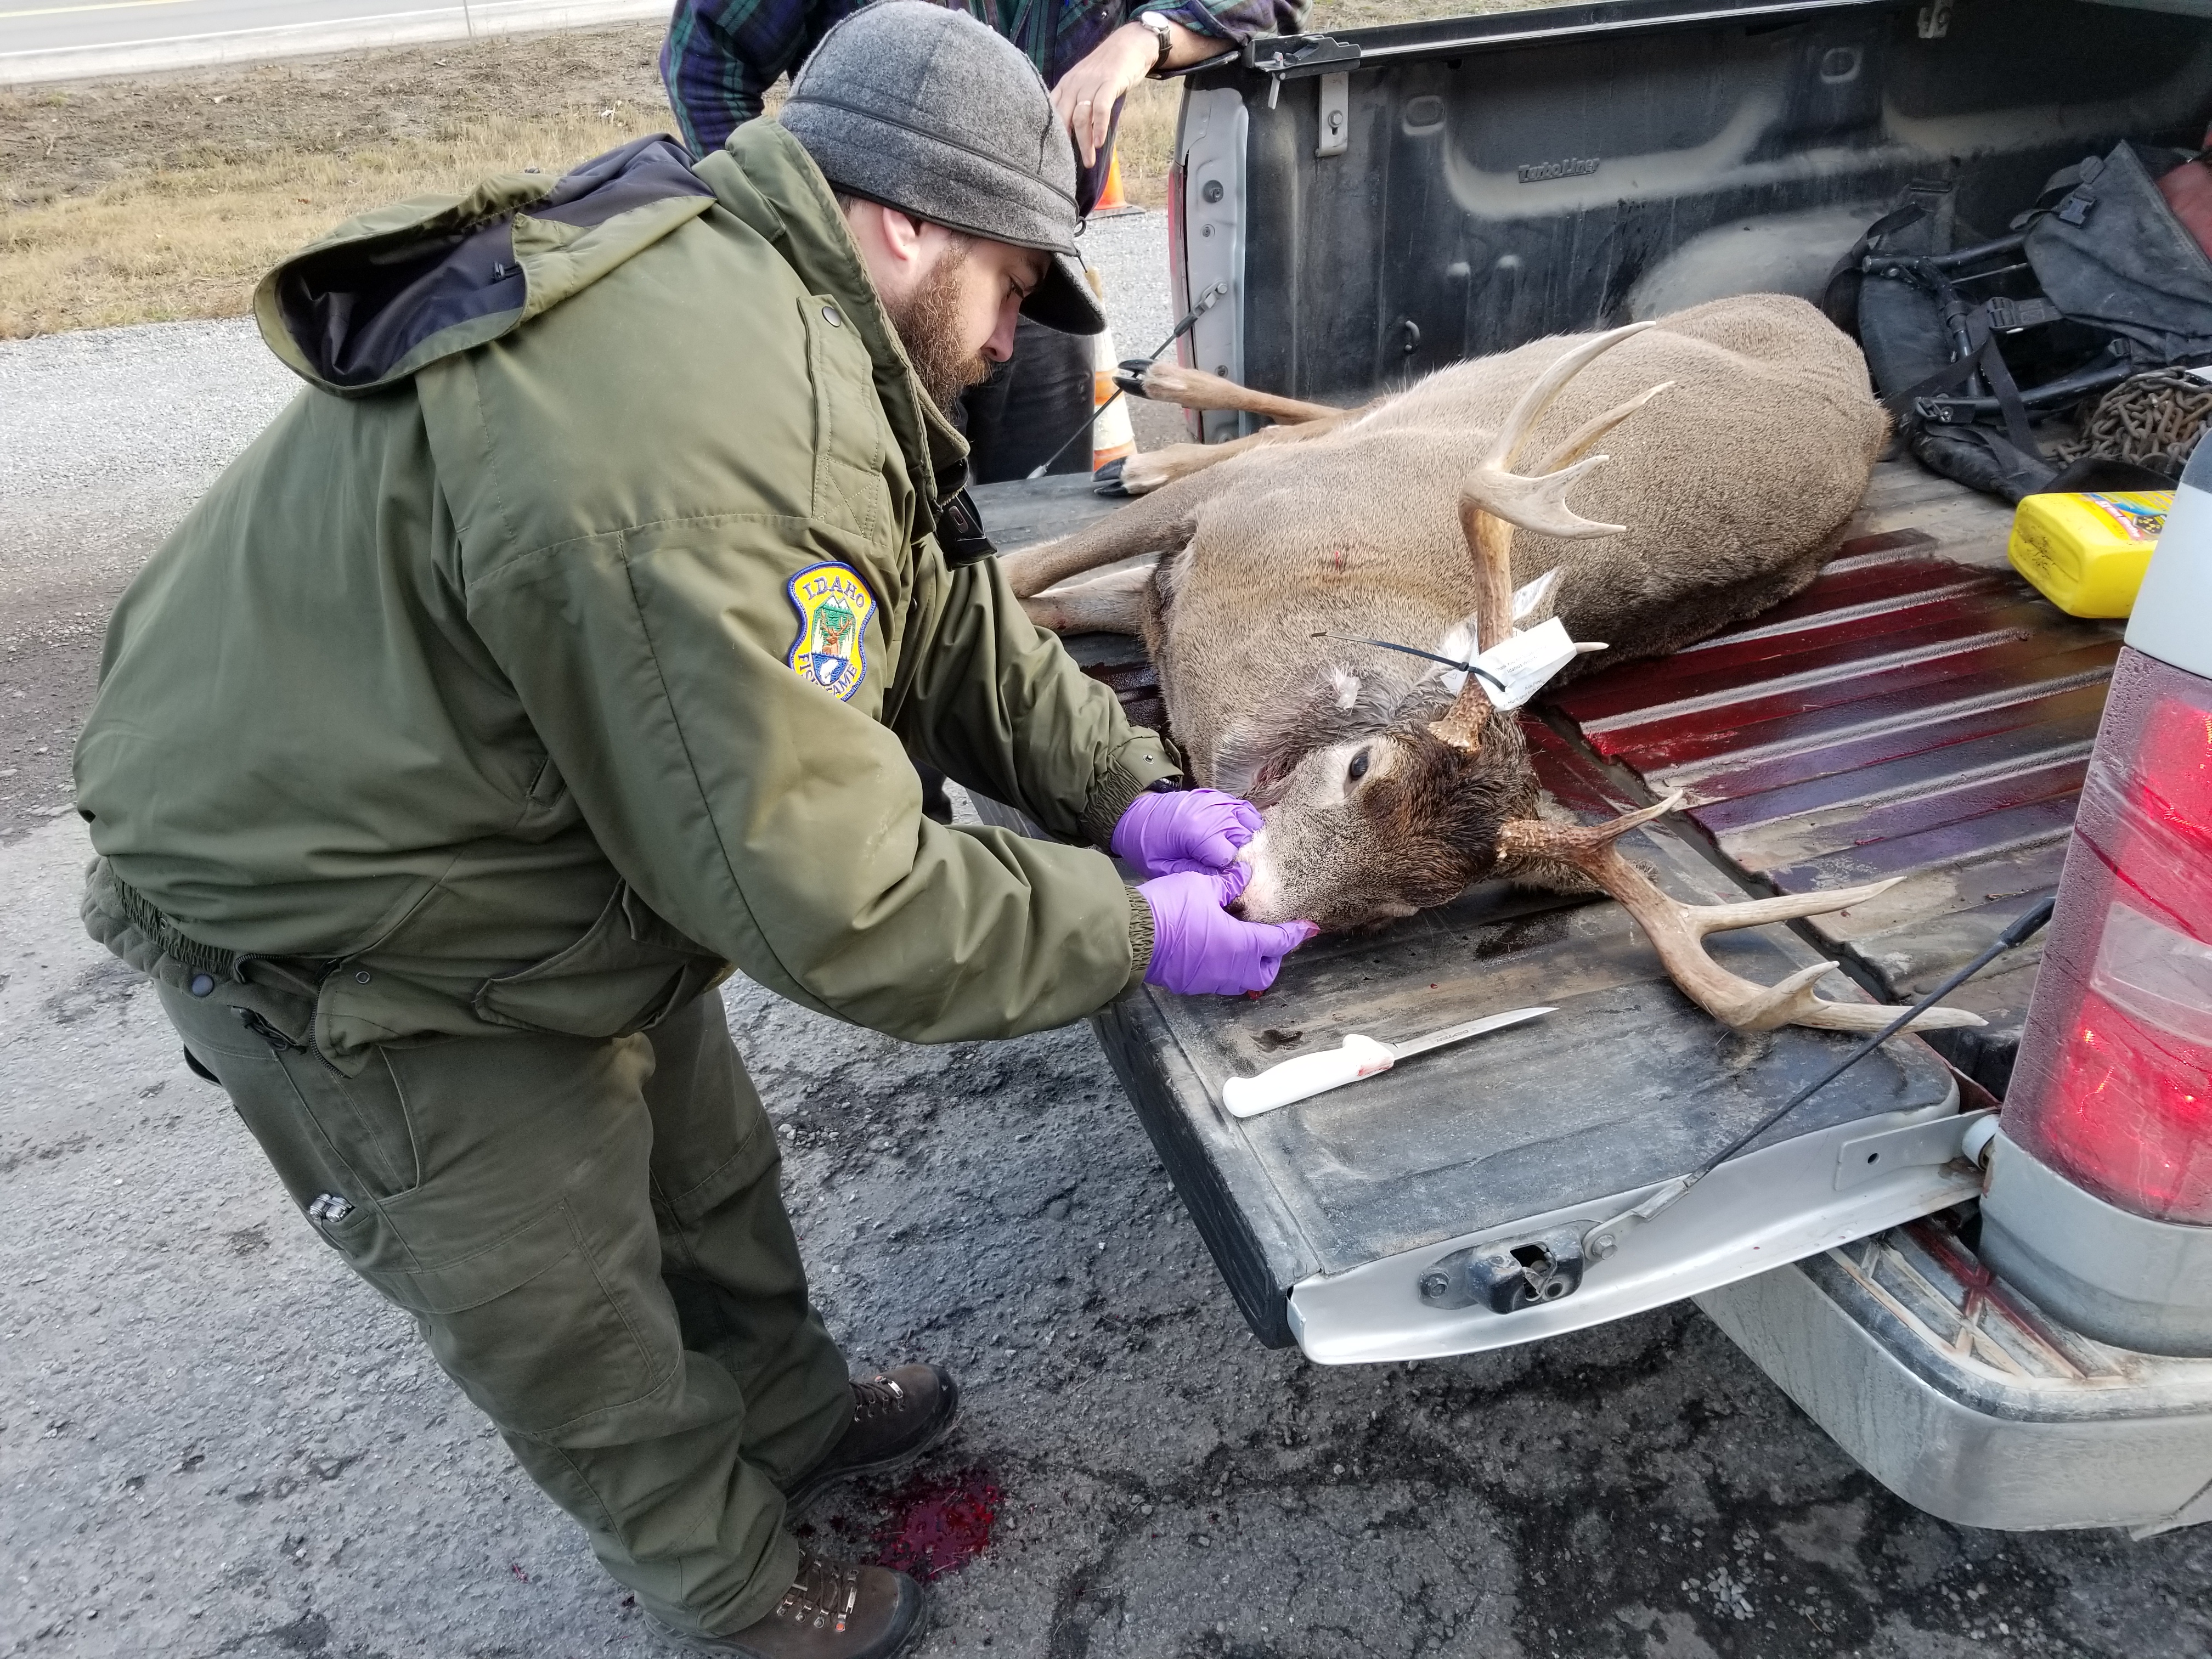
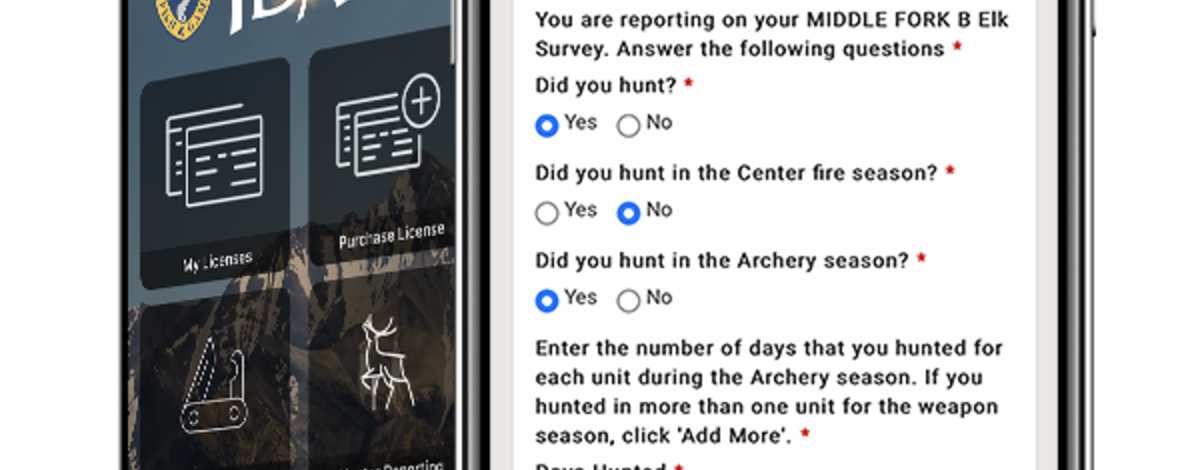
Although the graveyard may not be as exciting as the white-tail woods, understanding how many and what sorts of deer were harvested in the past grants biologists a glimpse into white-tailed deer population trends through time. To do this, Idaho Fish and Game biologists use information provided by hunters during check stations and Mandatory Hunter Reports. With this information, biologists can determine harvest numbers, how many bucks and does were harvested, how many points were on the antlers of harvested bucks, hunter success rates, and the number of days hunters spent in the field. As this information builds up over time, biologists can compare similarities and differences in white-tailed deer harvest between seasons and gauge what is going on with white-tailed deer populations, even when we cannot count them from a helicopter!
When a shift in white-tailed deer harvest is detected between years, biologists look to identify the cause of that shift. For example, decrease in harvest could be expected and observed following a disease outbreak of Epizootic Hemorrhagic Disease (EHD). Alternatively, harvest will likely increase following multiple years of mild winter and summer conditions that result in high fawn survival. Because there are many factors that can influence a population, it is an important to consider all factors that could be impacting our white-tailed deer when preparing to make a management decision.
Since 1975, Fish and Game staff have relied on harvest information from hunters to determine what is happening with white-tails. Harvest information provides the basis for wildlife managers across the United States and Canada when it comes to white-tailed deer because they face the same challenges as we do in Idaho when it comes to estimating white-tail populations. This is why providing the Department with information about your hunting experience is so important. Your hunt provides a data point that will help inform biologists and be considered in Idaho’s white-tail management.
Clearwater Region white-tailed deer example
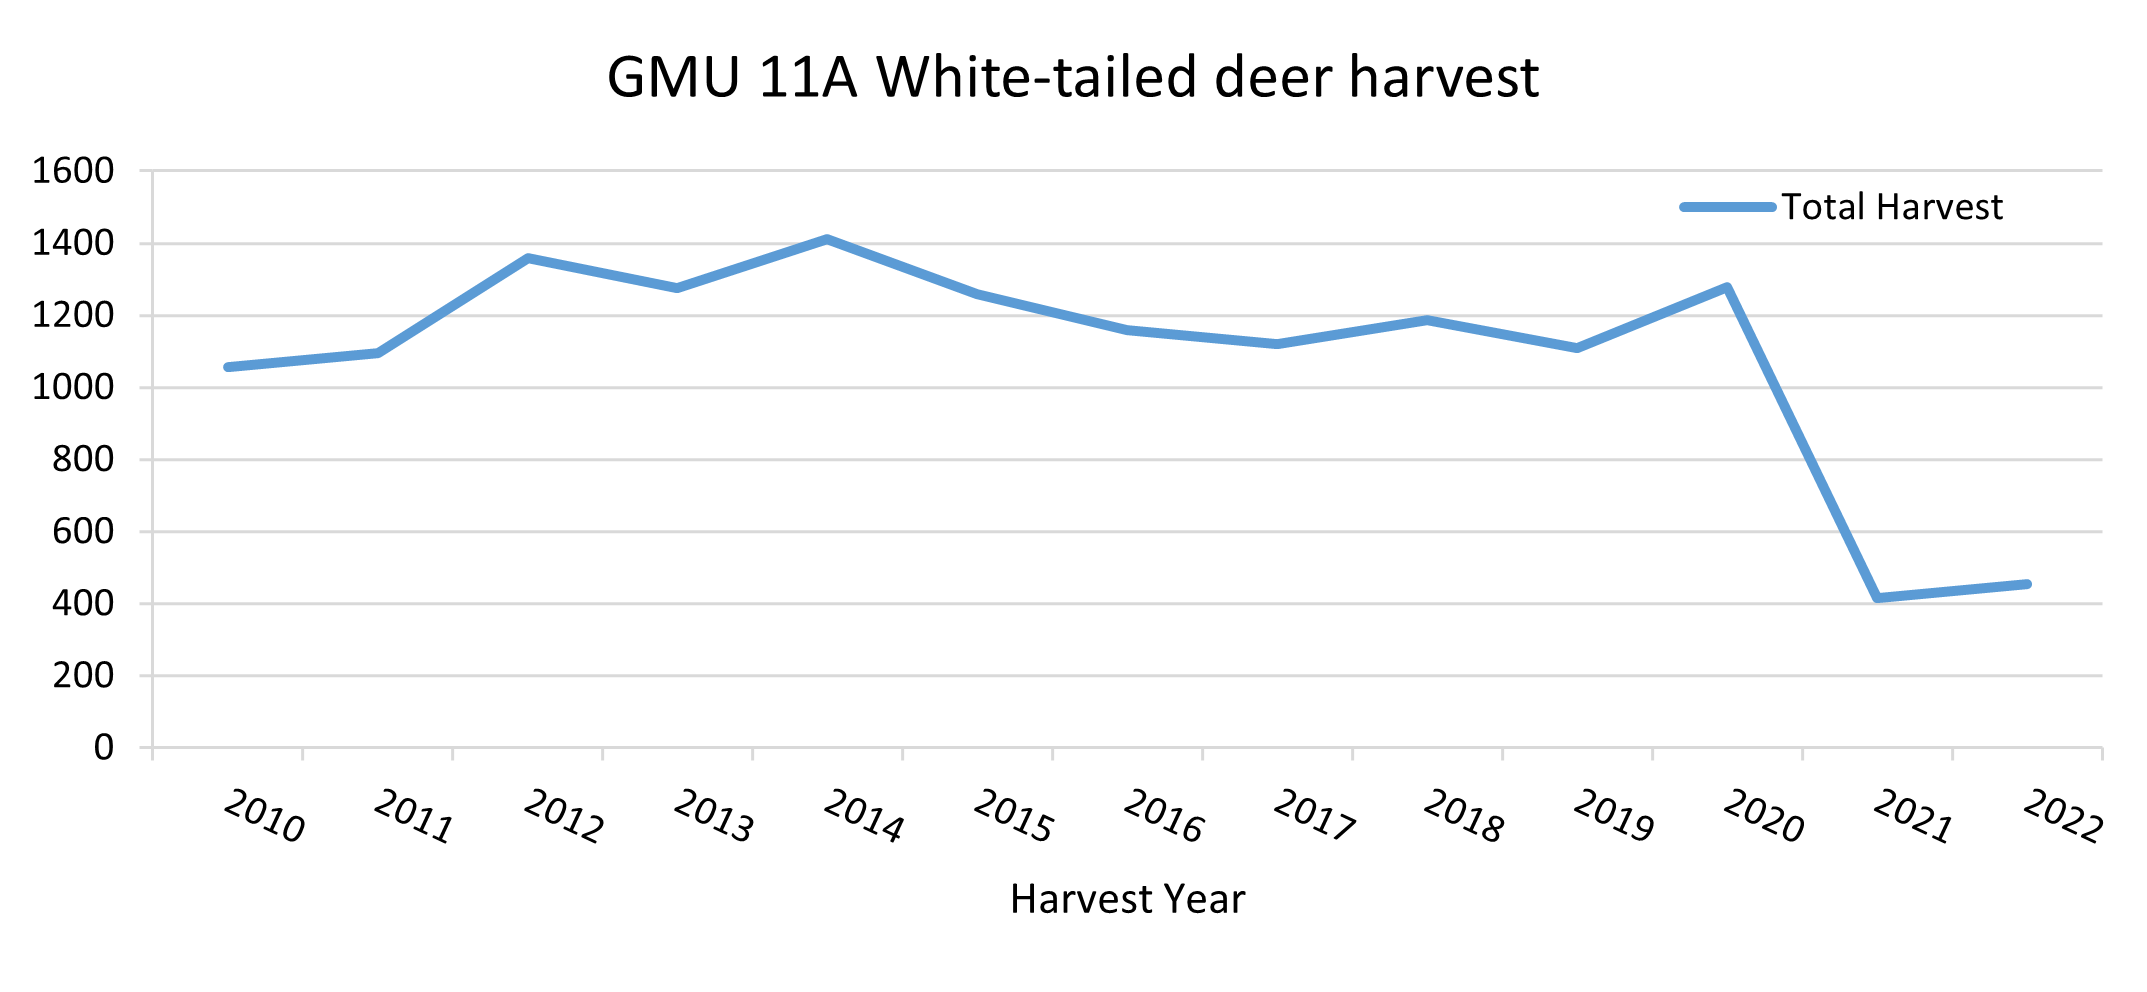
Now that we understand the challenges of counting white-tail deer and how to overcome those challenges in a state like Idaho, we can look at an example of using harvest data to inform management in the Clearwater Region. The figure below charts the total white-tail deer harvest in Game Management Unit (GMU) 11A. Before reading ahead, you should look at the figure and consider:
- What is the population is doing?
- What other information may help me understand what is going on?
- If a change in management is necessary?
After review,
- What is the population doing? –Dropping, and fast! What gives? It looks like everything was doing alright until 2020 but then our harvest dropped and it looks like our population took a turn for the worst!
- What other information may help me understand what is going on? –Since hunters provide information every year, it would be helpful to look at this harvest trend over a longer time period and see if our harvest is way outside of the norm. Also, what happened in 2020? Why did harvest drop off so quickly? Lastly, we should look at how many hunters were out during this same time period to see if that number may have changed.
Before we get to a management decision, it is time to put on our biologist cap, do some homework, and put our knowledge of harvest statistics to work.
- After doing some digging, we found harvest information dating all the way back to 2001, thankfully hunters were reporting all the way back then! The data submitted by those hunters’ shows that our current harvest is below the usual harvest for the unit.
- So what happened in 2021? We traced the decline in 2021 harvest back to a documented EHD outbreak in the region. Unfortunately, the 2021 EHD outbreak resulted in many white-tails becoming sick and succumbing to the disease. So, this could explain our dramatic decline in harvest, right!? Possibly, but one more thing…
- One final important piece of information that should be considered is how many hunters were in the unit during this time. Although giving up your ‘good’ hunting spot is unheard of, many hunters are more willing to share where not to go when hunting is ‘poor’ - want to know how I know?
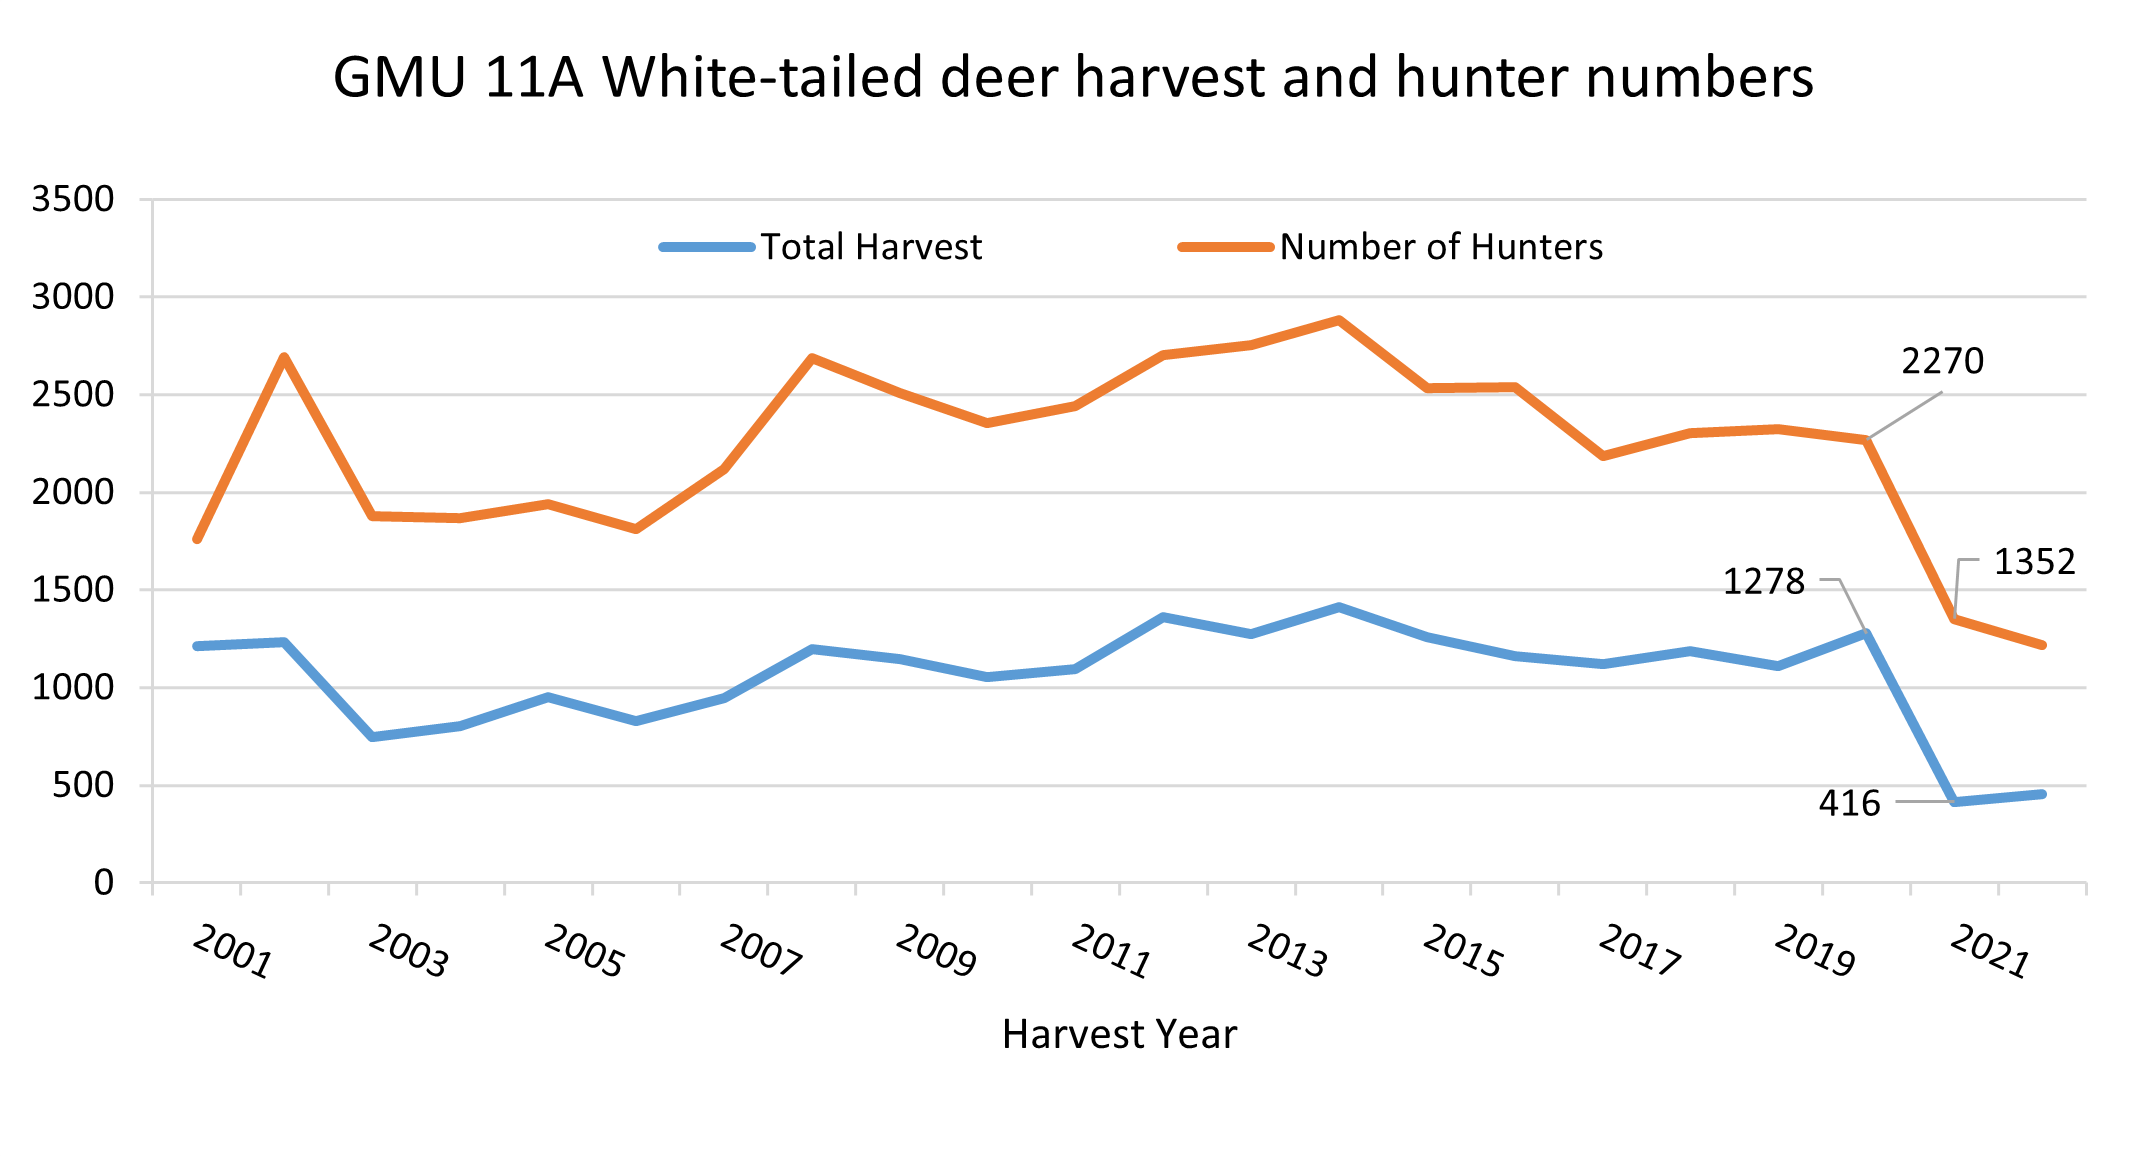
White-tailed deer harvest dropped around 67% in GMU 11A in 2021. That is a cause for concern! Especially because this trend falls outside the norm for white-tail harvest in this unit since 2001. However, what is going on with hunter numbers around the same time? Hunter numbers dropped nearly 40% across the unit in the same year! In fact, hunter numbers, like total harvest, are at an all-time low for the unit. Deer numbers were down, but how can managers expect harvest to remain stable with less hunters? The short answer, we can’t.
3. So, is a management change necessary?
In this instance, Fish and Game shortened the season in unit 11A by 11 days to help white-tailed deer populations recover from the effects of EHD. Thankfully, Fish and Game had hunter information to help inform this recommendation and make a decision based on past harvest and hunter effort. All things considered, a change was still recommended but the severity of the change could have been much different without the full picture.
With this example in mind, next time you wrap-up a hunting season with or without a filled tag, remember that the information right in front of you helps provide Fish and Game with the data to make these types of decisions.
Please feel free to check out the statewide harvest statistics on our webpage to learn more about what harvest looks like in your favorite unit or a unit you have always thought about hunting. Maybe it will point you to a promising new hunt! Thank you for taking the time to learn about harvest statistics and their role in white-tailed deer management.
Good luck on your next hunting adventure!