idfg-badge

Idaho Fish and Game

Fishing for Spring Chinook Salmon

Spring Chinook Salmon Fishing Update 4/25/2024: Rapid River Run, Hells Canyon, and Clearwater River Fisheries

idfg-jdupont

by Joe DuPont

Hi everybody.

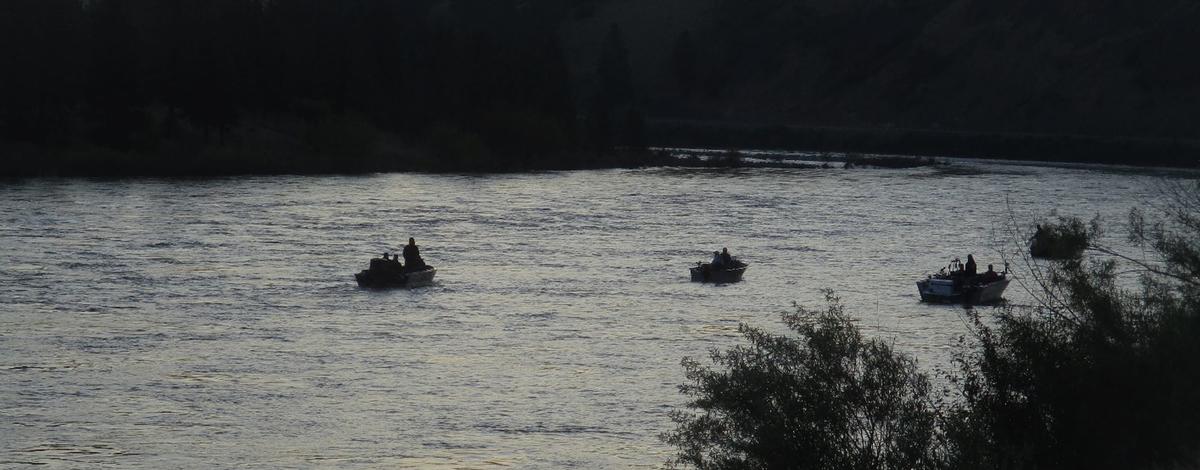
The spring Chinook Salmon season starts this Saturday (April 27, 2024), so I figured it was time to start providing my weekly spring Chinook Salmon fishery updates. These updates will cover the Rapid River Run fishery that occurs in the lower Salmon and Little Salmon rivers, the Hells Canyon fishery which occurs from Hells Canyon Dam downstream about 50 miles to Dug Bar boat ramp, and the Clearwater River basin fishery.

My plans are to provide weekly updates on these spring Chinook Salmon fisheries from now until they close. These updates will provide information on what the run looks like, what our harvest share is, how many fish have been harvested, where people are catching fish, and any changes in the seasons or limits that might have or will occur. I will try to get these updates out by at least Wednesday each week (I will skip next week due to an out-of-town conference I will be attending). 

Seasons and Limits

For those of you who are unsure of what the seasons and limits are for this year, you can click on this link (2024 spring Chinook rules) to get all the details on what river reaches are open, when the fisheries occur, and what the limits are. Because changes in the fishery can occur quickly, before going out, please be sure to check this website, contact IDFGD staff, or follow the blogs I put out to get an up-to-date status on the different fisheries.

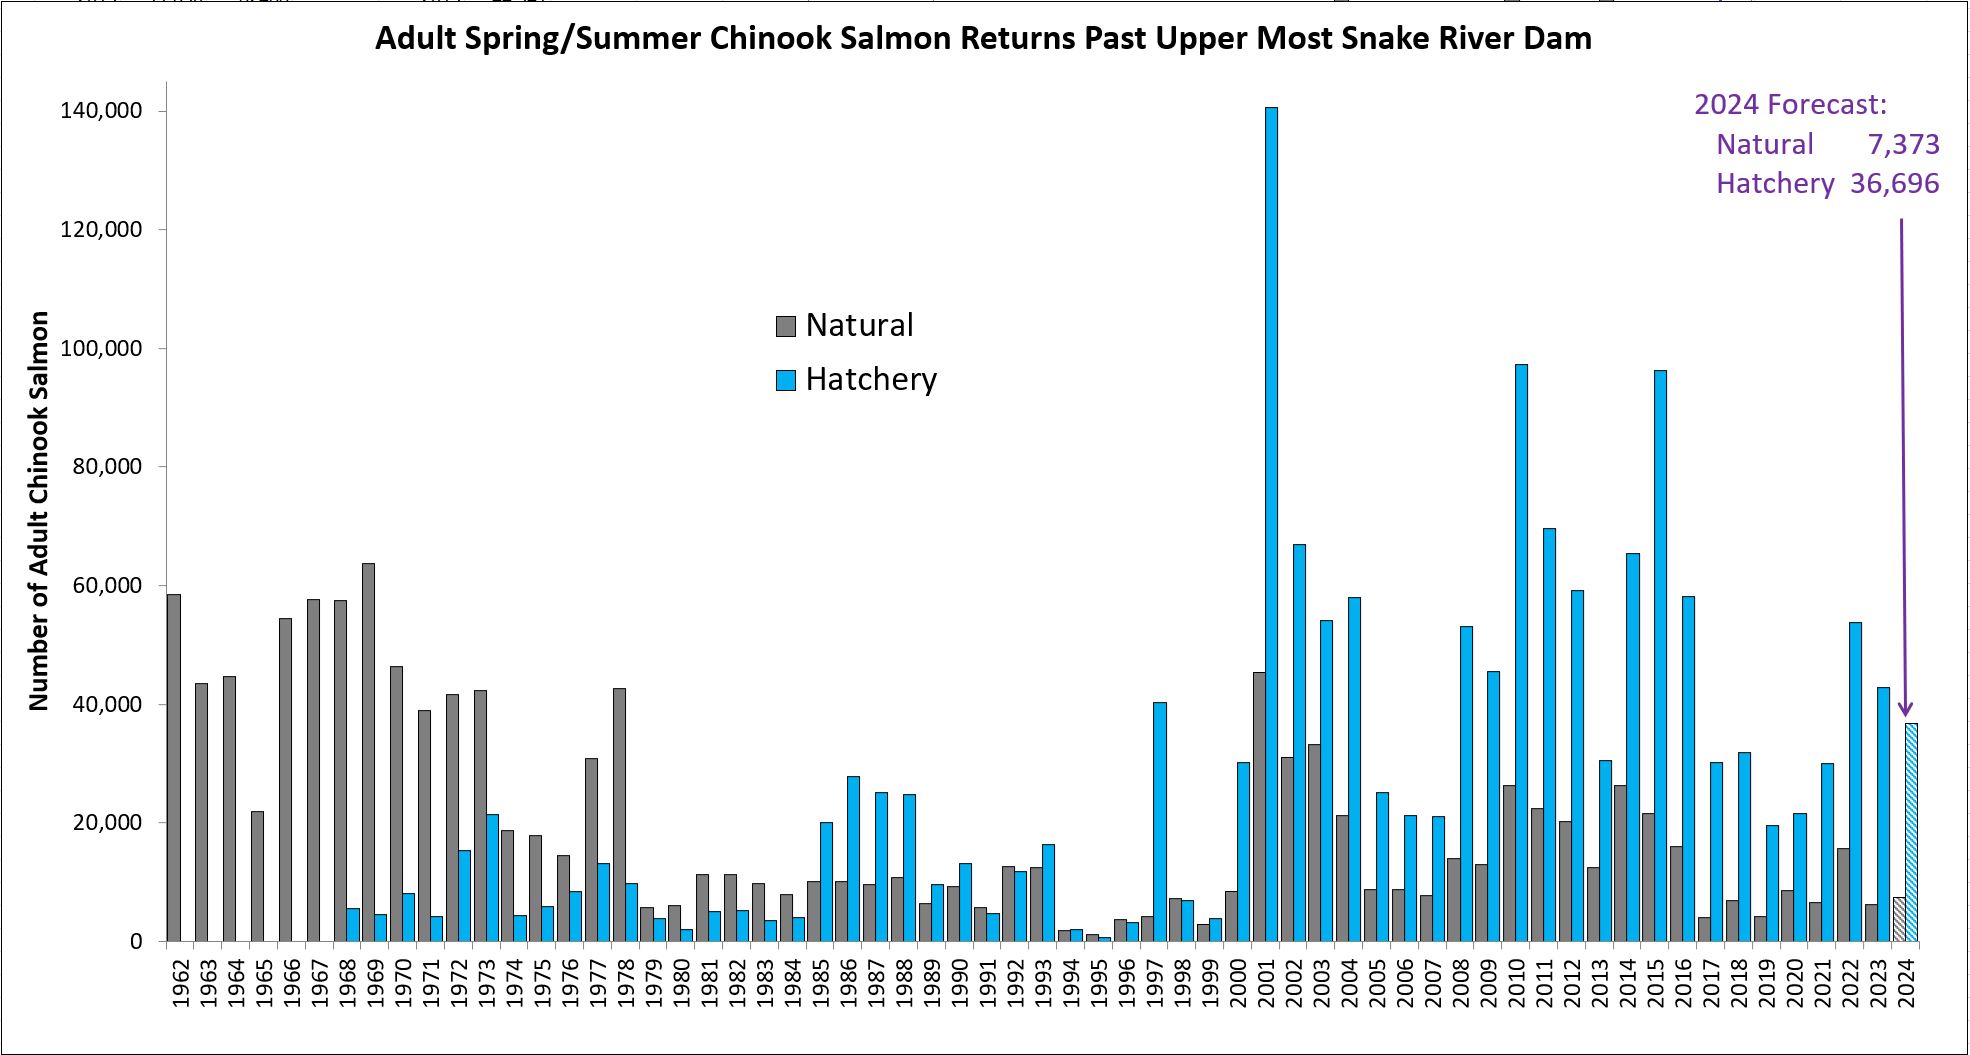
Several of you asked, when providing my first update, if I could explain what type of public support there was for starting the seasons the way we did. I think this is a great idea, so I have added the section below (2024 Public Input and Season Setting) that covers why the Fish and Game Commission adopted the seasons and limits they did to start the fisheries this year. If this is not of interest to you, and you just want to learn what this year’s return is looking like, just skip down to the section called “2024 Forecast”. 

2024 Public Input and Season Setting

First, I want to thank all of you who provided comments on how you would like this year’s spring Chinook Salmon fisheries managed. Without your involvement, we wouldn’t be able to manage these fisheries in a manner that is satisfying to most anglers. 

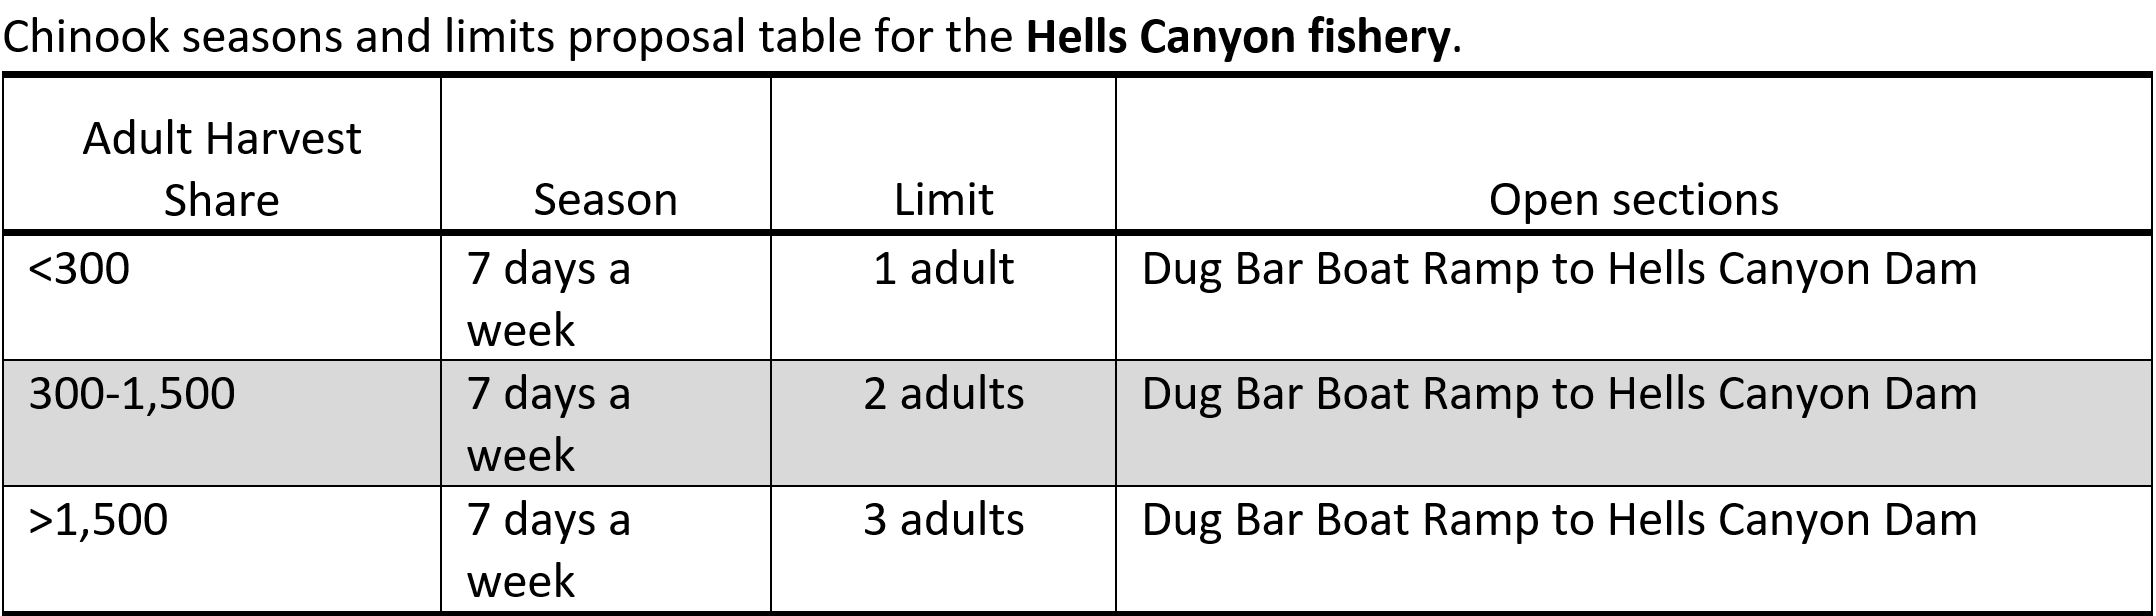
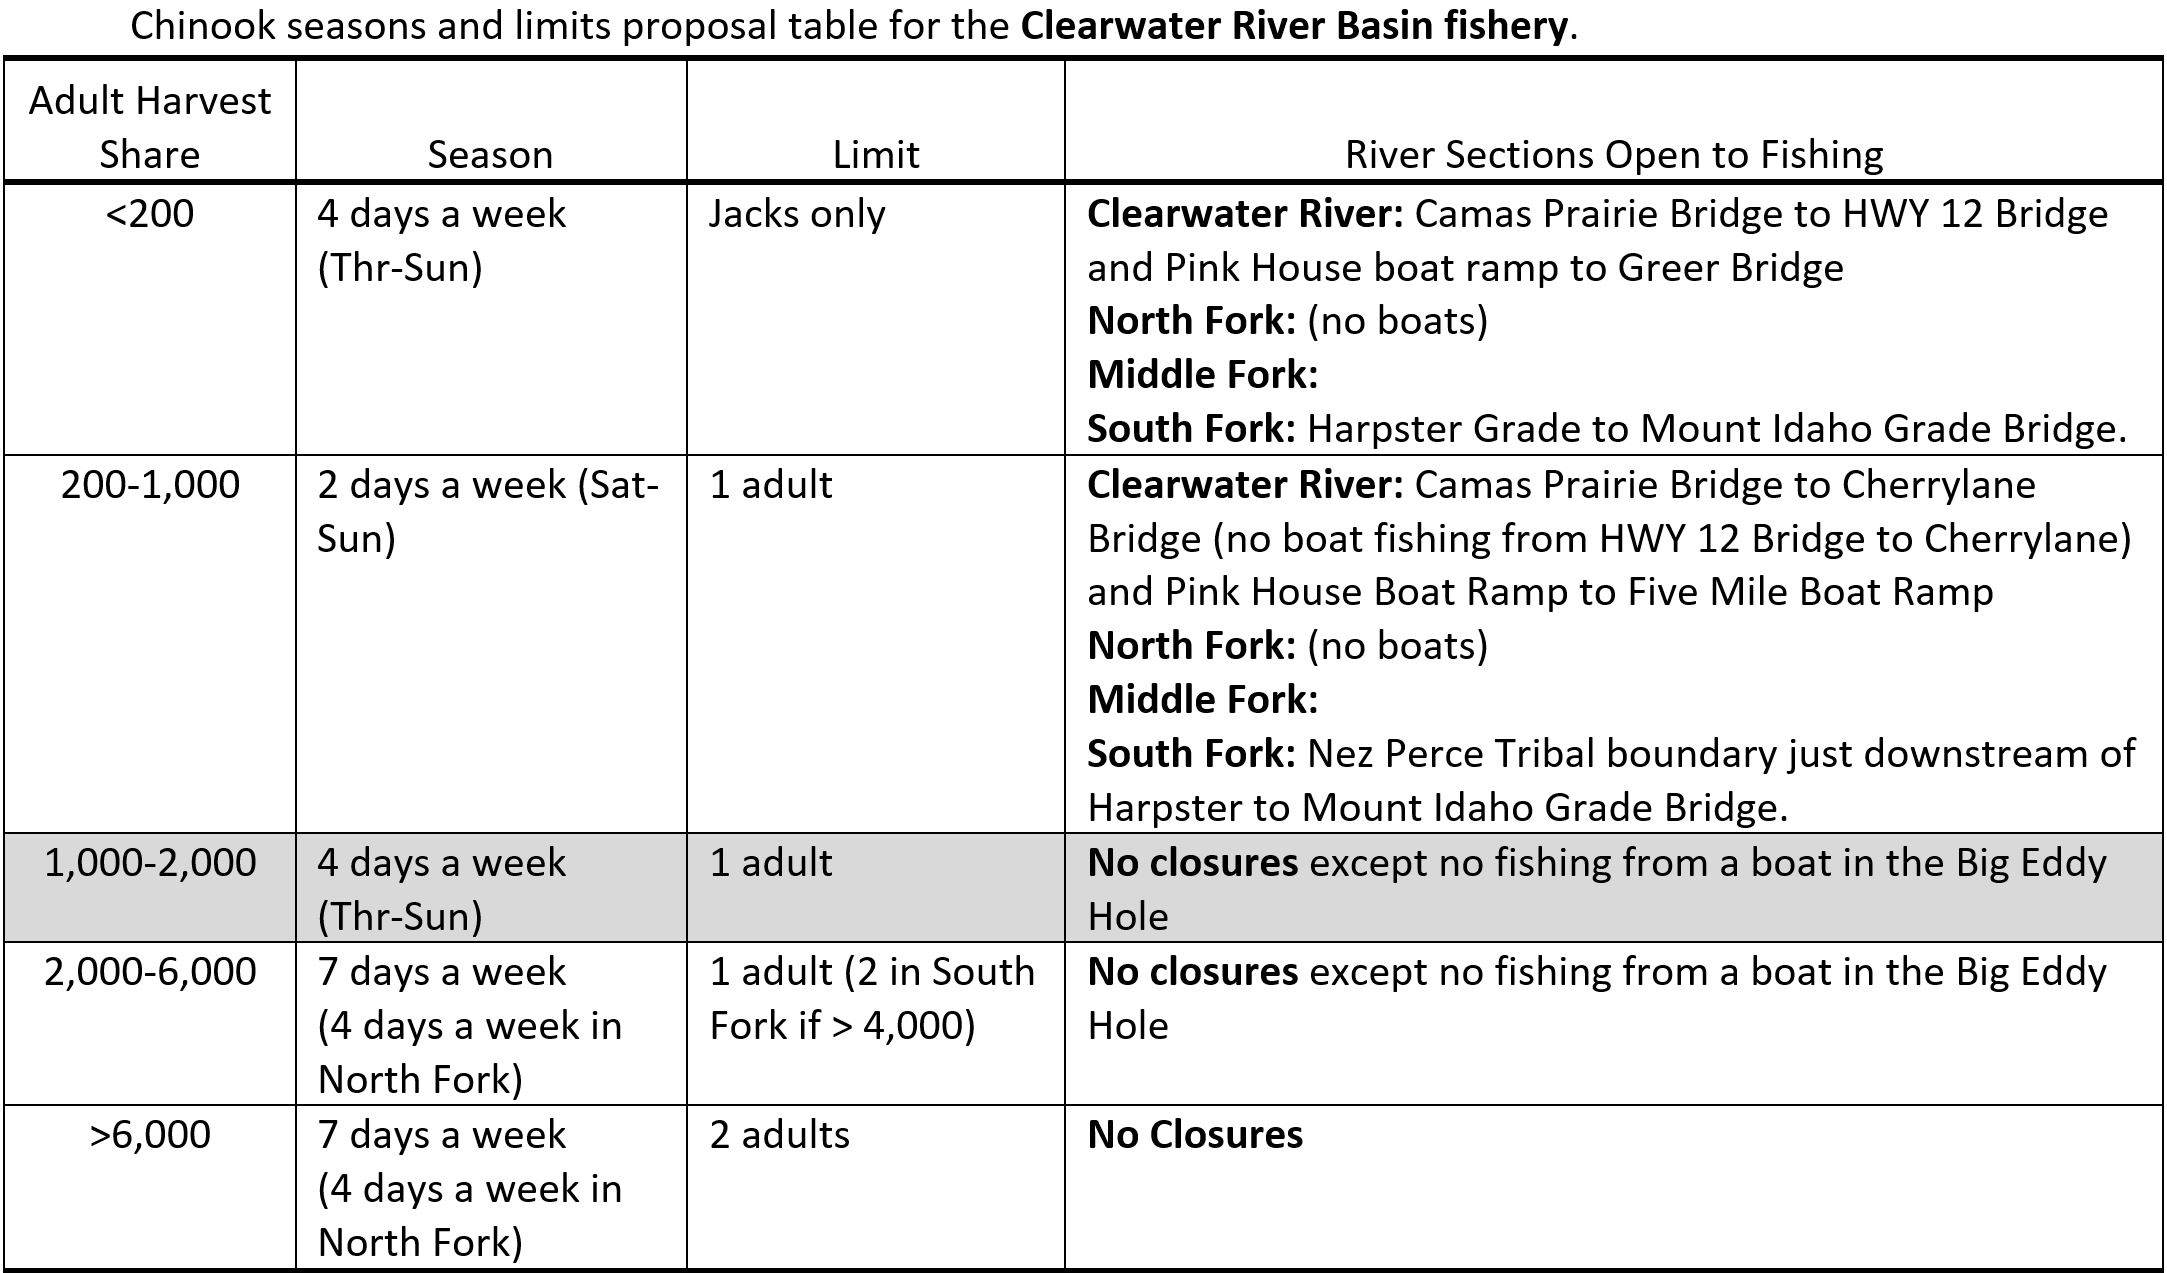
One thing people should be aware of is that over the years we have worked with the public to develop tables that describe the types of seasons and limits they would like to see implemented based on the size of the run. We often refer to these tables as “harvest matrixes”. I have included the harvest matrix for each of the three spring Chinook Salmon fisheries below. You will notice that these tables all have the same column headers, and the first column header is called “Adult Harvest Share”. The more harvest there is available, the more days of the week you can fish, the higher the limits will be, and the more areas will be open to fishing. The goal is to provide lots of fishing opportunities when the runs are large, but as the harvest shares decline, regulations would become more restrictive to help extend the length of the season and help IDFG better distribute harvest fairly. These tables have been tweaked over the years, typically at the request of the public, to provide more of the types of opportunity the public desires. People should be aware that in our public input process (public meetings and internet survey) we ask people if they are supportive of the guidelines provided in these harvest matrixes, and typically we go with “majority rules”. 

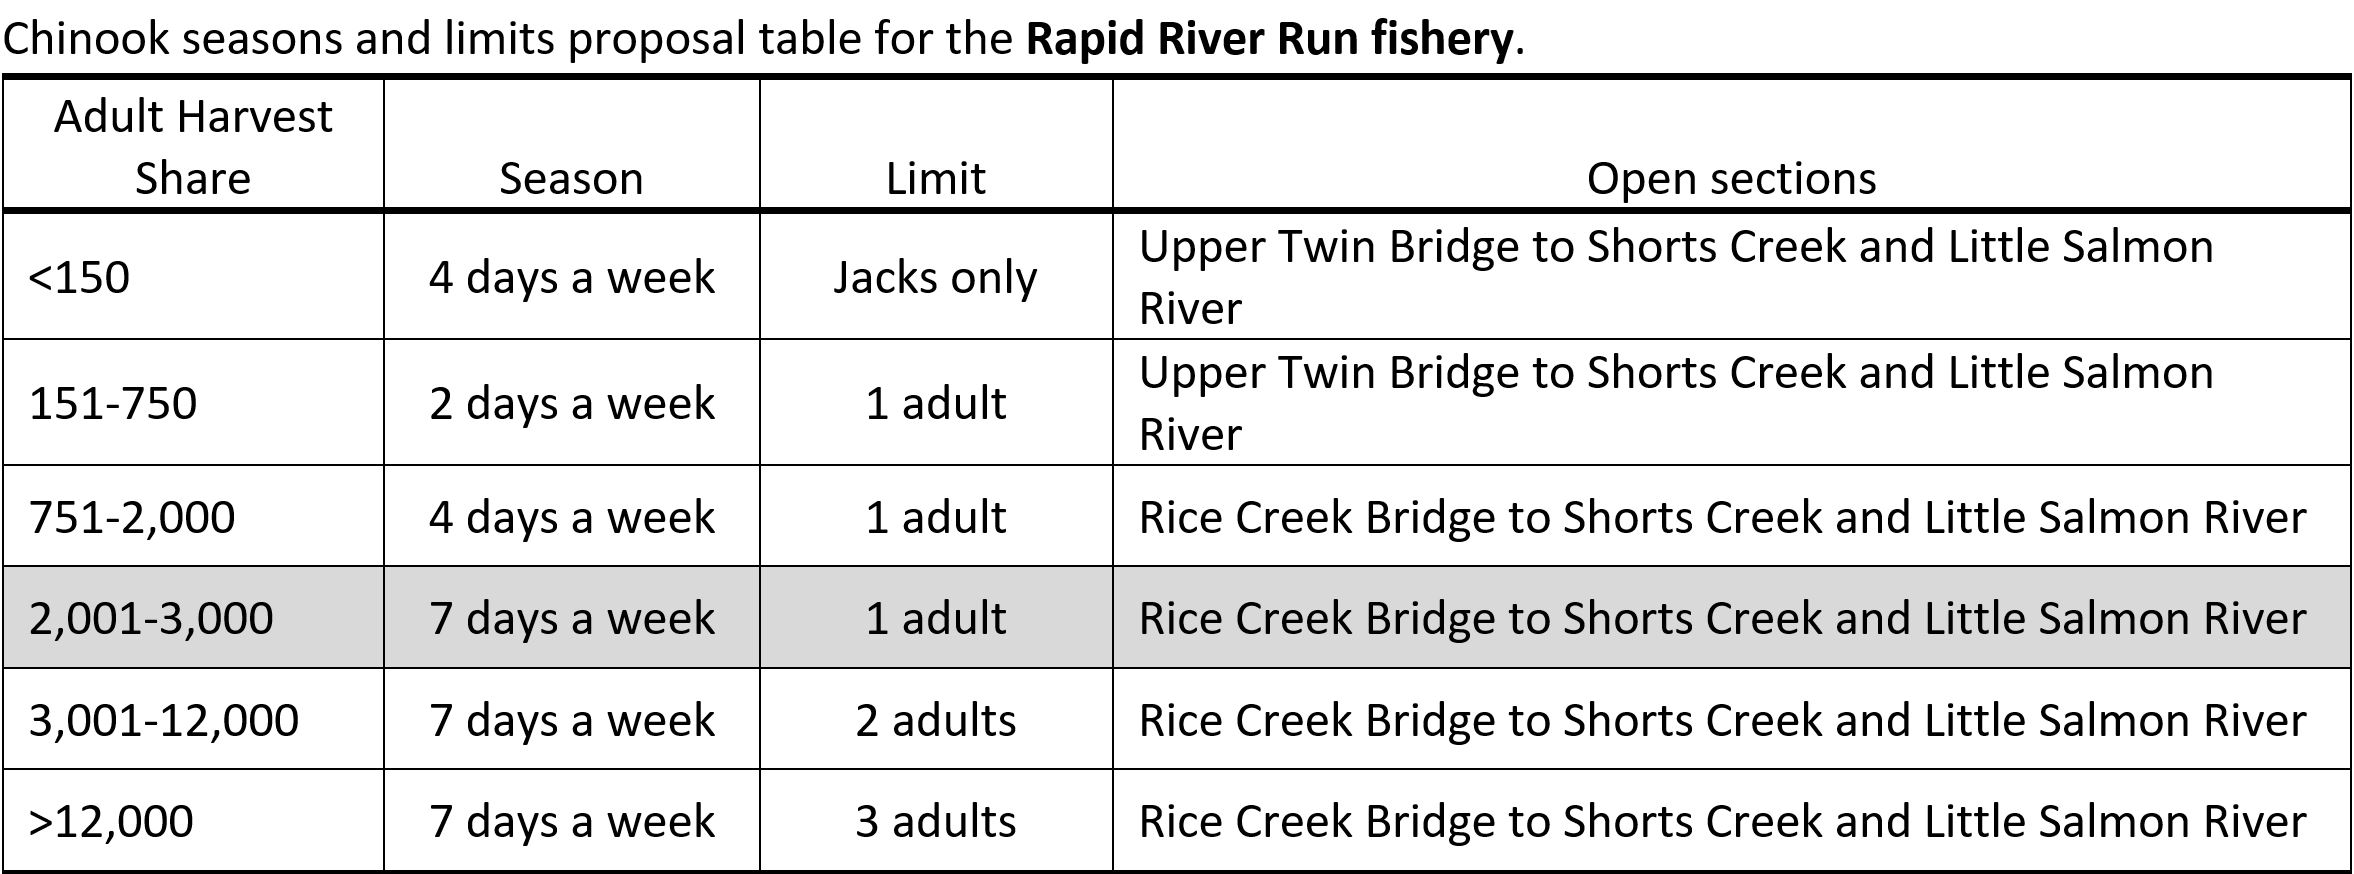
Rapid River Run Fishery

The harvest matrix below is for the Rapid River run fishery, and the reason there is a row shaded in grey is because this year we forecasted the harvest share would be about 2,500 adult fish. This year we asked the public (at public meetings and through the internet) if they wanted to start the season using the guidelines described in the shaded area of the table below or if we should start with more restrictive seasons and limits (next row up) seeing last year the run came in significantly less than forecasted. About 42% of the people who responded to this question said they wanted us to follow the guidelines in the grey shaded row in the table below; 53% said they wanted us to start more restrictive (row above the grey); and 5% said they didn’t like either option. In this case, we went with “majority rules”, and IDFG staff recommend to the commission to follow the season and limits specified in the row for harvest shares between 751-2,000 adult fish (4-day/week fishery and 1 adult daily limit). The commission adopted this recommendation.

Rapid River harvest matrix

Another question we asked the public about the Rapid Run Fishery was whether we should continue to try and distribute harvest 50/50 between the lower Salmon River and Little Salmon River or change to where we would provide 55% of the harvest in the lower Salmon and 45% in the Little Salmon River. About 52% of the people voted for 55/45 (lower Salmon/Little Salmon), 32% voted for 50/50, and 16% didn’t like either of these options. Most (80%) of those who didn’t like either option thought more than 55% of the harvest should go to the lower Salmon River. Based on these responses, when managing this fishery, we will try and distribute harvest so that 55% goes to the lower Salmon River and 45% goes to the Little Salmon River.

Anglers should also be aware that we will not be opening the lower Salmon River upstream of Shorts Creek this year. We will not be opening this section of river because we have learned that a significant number of the fish harvested in this reach of river are destined for upstream fisheries (South Fork Salmon River or upper Salmon River).

Hells Canyon Fishery

The harvest matrix below is for the Hells Canyon fishery, and this year we forecasted the harvest share for this fishery would be about 600 adults. The shaded row in the table below captures this harvest share, and the seasons and limits associated with it. About 96% of the public who provided their opinion thought these seasons and limits were appropriate to start the season with. The commission adopted these seasons and limits based on this strong support.

Hells Canyon harvest matrix

Clearwater River Basin Fishery

For the Clearwater River Basin fishery, we forecasted the harvest share for this fishery would be about 1,360 adults. The shaded row in the harvest matrix below captures this harvest share and the seasons and limits associated with it. About 77% of the people who provided their opinion thought these seasons and limits were appropriate to start the season with. The commission adopted these seasons and limits based on this strong support.

Clearwater harvest matrix

Another topic we asked for the public’s opinion on was how to distribute harvest across the Clearwater basin. We shared information with people that showed, if we didn’t provide more harvest downstream of Orofino Bridge than we have in the past, that we would likely not reach our harvest share and fishing opportunity would be lost. With this understanding, people agreed (82% support) that more of the harvest should be allocated downstream of Orofino Bridge. Based on these responses, we will try to distribute harvest across the Clearwater River basin as described in the table below.

Clearwater harvest distribution goals

We discussed a lot more at our public meetings than I covered above in this article. If anybody wants more details on what we discuss and people’s opinions on any of these issues, please contact me and I will gladly share more information with you.

2024 Forecast

The adult forecast for hatchery spring and summer Chinook Salmon that will be migrating past Lower Granite Dam this year (last dam before entering Idaho) is 36,696 fish. This estimate is based on the number of jacks that returned last year. To give you a feel for how this forecast compares to previous returns, I have included a figure below that shows the number of adult spring and summer Chinook Salmon that have passed over the last Snake River dam before entering Idaho since 1962 (the year Ice Harbor Dam was completed). The blue bars represent the adult hatchery returns and grey bars represent natural returns. The general take-home message for the hatchery return is we are forecasting a return that will be a little less than last year, and less than the 10-year average (~45,000). The forecasted return for natural fish is 7,373 which is 64% of the 10-average (~11,600). This is not a good forecast, and if it is accurate, we will have to manage our sport fisheries carefully in the Salmon River to ensure we don’t exceed our allowed “wild fish impacts”.

Spring Chinook Salmon returns to Idaho 1962-2024

What is the run looking like now (4/25/2024)

So, let’s talk about what the return looks like now. To best understand what the run looks like right now, we need to look at fish counts and Bonneville Dam. I created the figure below that compares this year’s return (red line) to last year’s return (solid black line) and the 10-year average (dotted black line). As you can see, we are still early in the return so a lot can change from now. However, the run is looking favorable as more fish have passed over Bonneville Dam to date (4/25/2024) than in the previous seven years. Granted, the previous seven years were not that great, but at least this is a good sign. I don’t like the drop in numbers that occurred the past three days, but it is not unusual for counts to jump up and down in response to changes in discharge at Bonneville Dam.

Bonneville daily counts 4-25-24

The obvious next question is how many of the fish passing over Bonneville Dam are destined for our fisheries in Idaho. To get at that question, we need to look at detections of PIT tagged fish at Bonneville Dam. The table below summarizes the PIT tag data we have collected to date (through 4/24/2024). Because this is the first time I am presenting this table this year, I will go over it in more detail to make sure we all are on the same page. The information in the first column “Release Group” represents where the PIT tagged fish were released as smolts and which hatchery released them. Most adults will return to the location they were released as smolts. The second column indicates how many fish from each of these release groups we estimate have passed over Bonneville Dam to date. Because we PIT tag a known proportion of fish at the hatchery, we can expand each PIT tag detection using this proportion to estimate the actual return. The third column shows how many fish we project will ultimately pass over Bonneville Dam. This data is the tricky part because we don’t know how many fish are yet to come. To project how many fish are yet to come, we look at run timing curves (similar to what is shown in the figure above). In this case, I assumed this return has an average run timing (6-10% complete depending on release location). If the run is earlier than I projected, fewer fish will make it to Bonneville than estimated, and if the run is later than projected, more will come back than estimated. Finally, the last column shows what we are estimating our harvest share will be for the three fisheries that will open this weekend. The harvest share is calculated by estimating how many of the fish that pass over Bonneville Dam will make it to Idaho (typically around 70% make it to Idaho). We then subtract out how many of these fish are needed for broodstock, and then we divide these remaining fish in half (half are designated to the Tribes and half are designated to sport fisheries) to come up with our harvest share. 

Spring Chinook Harvest Share 4-25-2024

OK, now that you know what is presented in the table above, let’s talk about what this data means. Remember, we have three spring Chinook Salmon fisheries that are opening this weekend: Clearwater River return, Rapid River return, and Hells Canyon. The bold lines in the table above provides the totals for each fishery and the harvest shares in these rows are what we will use when managing the fisheries. This table shows that the Clearwater River return harvest share is projected to be 2,612 adult fish, 2,487 for the Rapid River return, and 824 for Hells Canyon. These numbers are important because when we achieve the adult harvest share in a fishery, it must be closed. Right now, the estimated Clearwater harvest share is a little above what we forecasted when we set our seasons and limits this winter, and the Rapid River and Hells Canyon returns are similar to what we forecasted. At this point, I wouldn’t get too excited or depressed about the harvest shares presented above as we are early in the run, and they can change significantly. 

I do need to make you aware that each year we collect genetic data from spring Chinook Salmon trapped at Lower Granite Dam to help us better understand how well the PIT-tagged fish are representing the actual return size. On average, PIT-tagged fish represent about 70% of the actual return. For example, if the real return was 1,000 fish, PIT-tagged fish on average would indicate the return was 700 fish. This underrepresentation is actually good as it helps ensure we make our broodstock needs because not all unharvested fish will make it to the hatchery trap due to straying and natural mortality. However, what we have learned from analyzing the genetic data is that occasionally PIT-tagged fish represent a much lower percent of the return - we have seen it as low as 45% in the past. On years when the PIT-tagged fish represent much lower than 70% of the return, we can increase harvest shares and still be confident we will make our broodstock needs. Typically, we will have enough genetic data collected by late May or early June to run the analysis, and the results should be ready about a week later. You may recall that we have increased the harvest share for the Rapid River return fishery in the past using this genetic data. I’ll remind you when we get closer to analyzing this data, so it doesn’t catch you off guard.

Clipping Chinook at Lower Granite Dam

Fisheries

If you are wondering whether it will be worth going salmon fishing this week, I can tell you that only about 50 adult Chinook Salmon have been counted at Lower Granite Dam – the last dam these fish pass over before entering Idaho. As such, it is very unlikely that you will catch a salmon if you head out fishing this weekend. However, we have documented somebody catching a fish in the past when fewer than 100 fish had passed over Lower Granite Dam.

As we start documenting harvest in our creel surveys, I will include tables in my updates that will show where and how many fish we estimate have been caught in each of the fisheries. Not only will these tables show where the fishing is good, but it also will give you a feel for how long a river reach will remain open before it achieves its harvest goal. 

Finally, I want to mention that with the lower flows that are occurring this year, fish will be able to make the migration from Bonneville Dam to Idaho faster than usual. Right now, it looks like they are taking about two weeks to make this migration. For those who like to fish the lower Salmon River, it takes about 7-10 days for a Chinook Salmon to migrate from Lower Granite Dam to the beginning of the fishery (Rice Creek Bridge) during average flows. However, if flows start exceeding 50,000 cfs in the lower Salmon River, significant delays can occur as the fish try to navigate the Slide Rapid. Right now, flows in the lower Salmon are at about 20,000 cfs.


That is all I have for you today.  Time to get your fishing gear ready as the fish will be here soon!